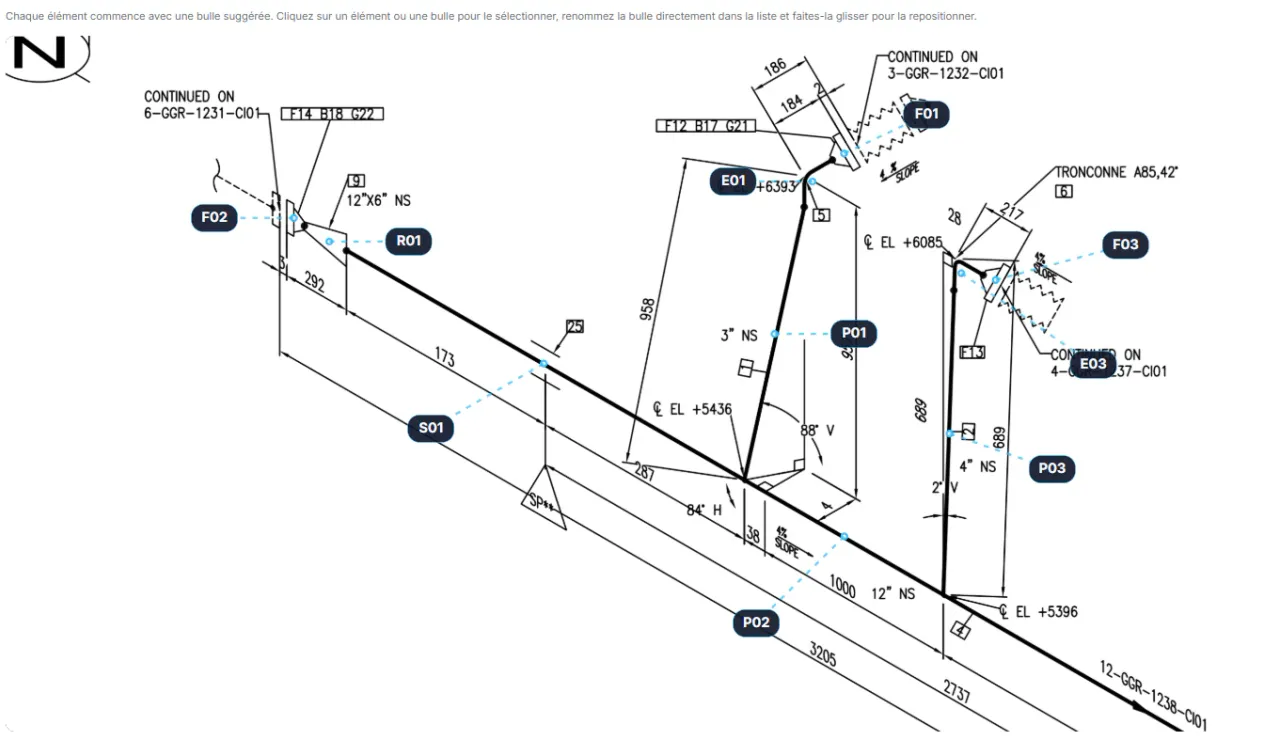
Piping isometric drawing analysis

Turn your isometric drawings into actionable data.

PipeVision automatically detects components, extracts technical data, reconstructs the network and calculates welds from your PDF and DWG drawings. Verifiable data to prepare estimating, fabrication and inspection.

Isometric drawing
Workflow
Piping component identification and bill of materials metadata association
  1. Identify
  2. Structure
  3. Estimate
  4. PrepareFabrication
  5. PrepareWelding
  6. Inspect
The same drawing, enriched at every stage

What your teams still do today

Your teams still spend hours finding information that is already there.

The drawings already contain the necessary information. Counting it, checking it and entering it into other systems still takes valuable time.

Estimate

  • Recount welds by DN, schedule and material
  • Rebuild the bill of materials from isometric drawings
  • Check a subcontractor’s quantities
  • Compare quotations and schedules line by line

Prepare

  • Copy and paste data into Excel or internal tools
  • Add fabrication callouts to isometric drawings
  • Prepare fabrication deliverables

Inspect

  • Re-create drawing callouts for inspection
  • Enter the data again into asset management or maintenance tools

PipeVision

Software that understands your isometric drawings.

PipeVision turns an isometric drawing into verifiable technical data to identify components, structure the network, estimate costs, prepare fabrication and welding, and organise inspection.

Explore PipeVision capabilities

01 — Identify

Identify components and retrieve their properties.

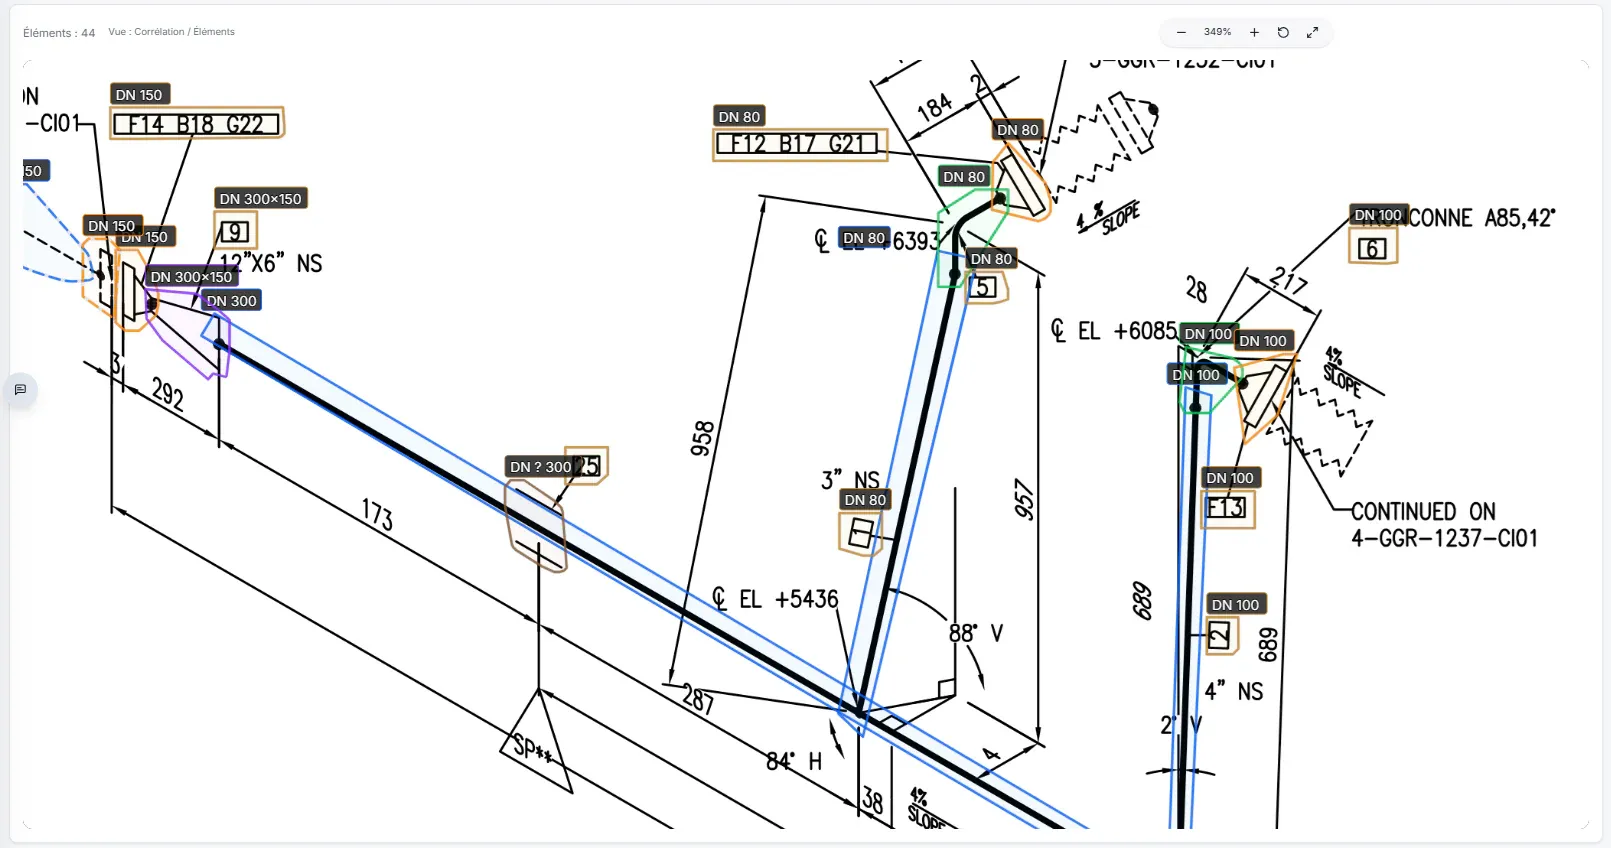
PipeVision detects pipe lengths, elbows and other components, then links them to BOM rows to associate their DN, schedule and material.

Components detected on an isometric drawing with associated bill of materials metadata
Components and BOM brought togetherEvery element remains located on the drawing and verifiable in its document context.

02 — Structure

Connect components to reconstruct the network.

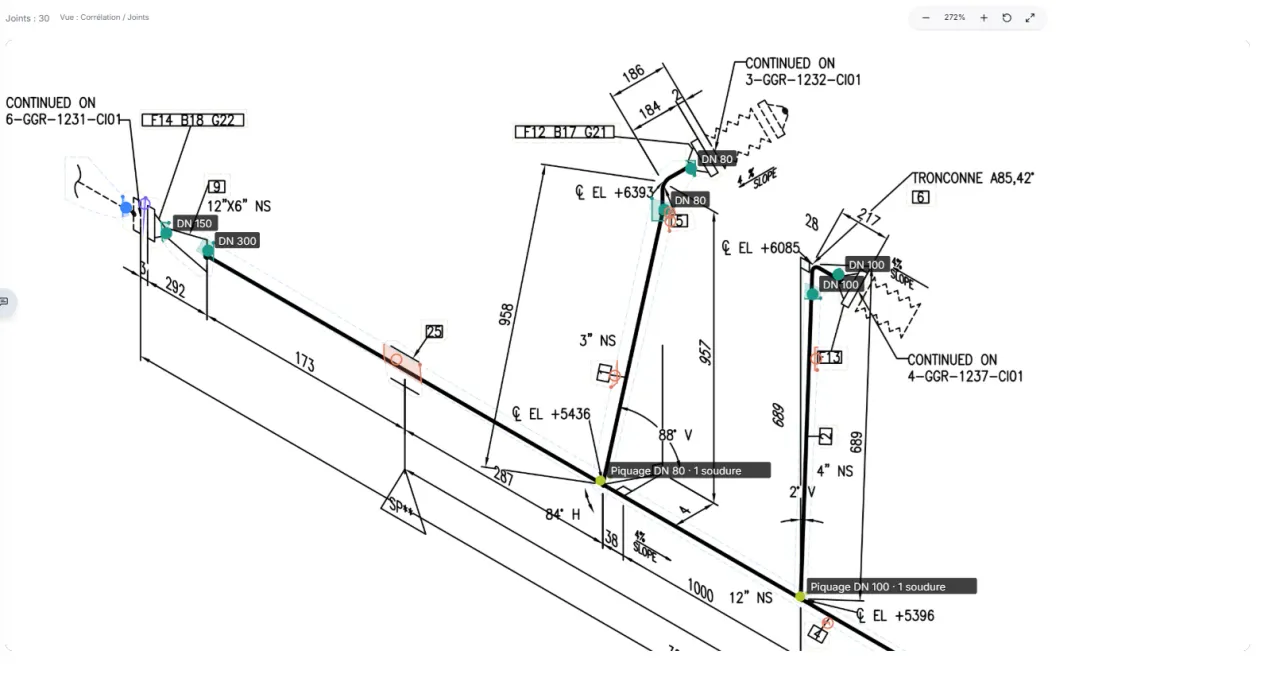
The drawing geometry and associated properties are used to reconstruct network connections and determine the welds.

Reconstructed piping network with welds listed in PipeVision
From components to the networkCalculated connections remain inspectable on the drawing and in the weld list.

03 — Estimate

Turn weld data into an estimate.

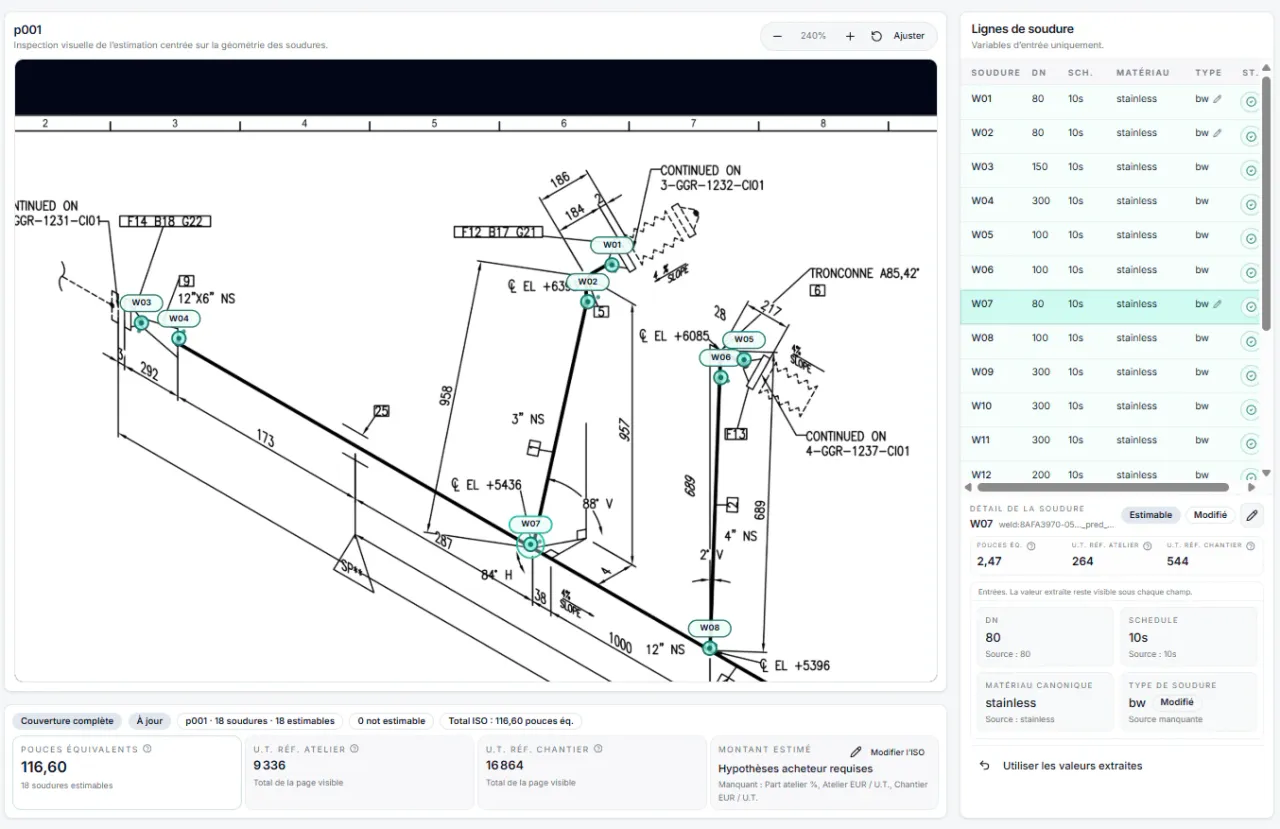
The identified welds prepare the weld book and feed the calculation of equivalent inches and reference work units for shop and field work, without automatically deciding their allocation.

PipeVision estimate view with equivalent inches and shop and field work units
A calculation linked to every weldResults remain traceable from totals down to the weld shown on the isometric drawing.

04 — Prepare

Prepare fabrication and welding.

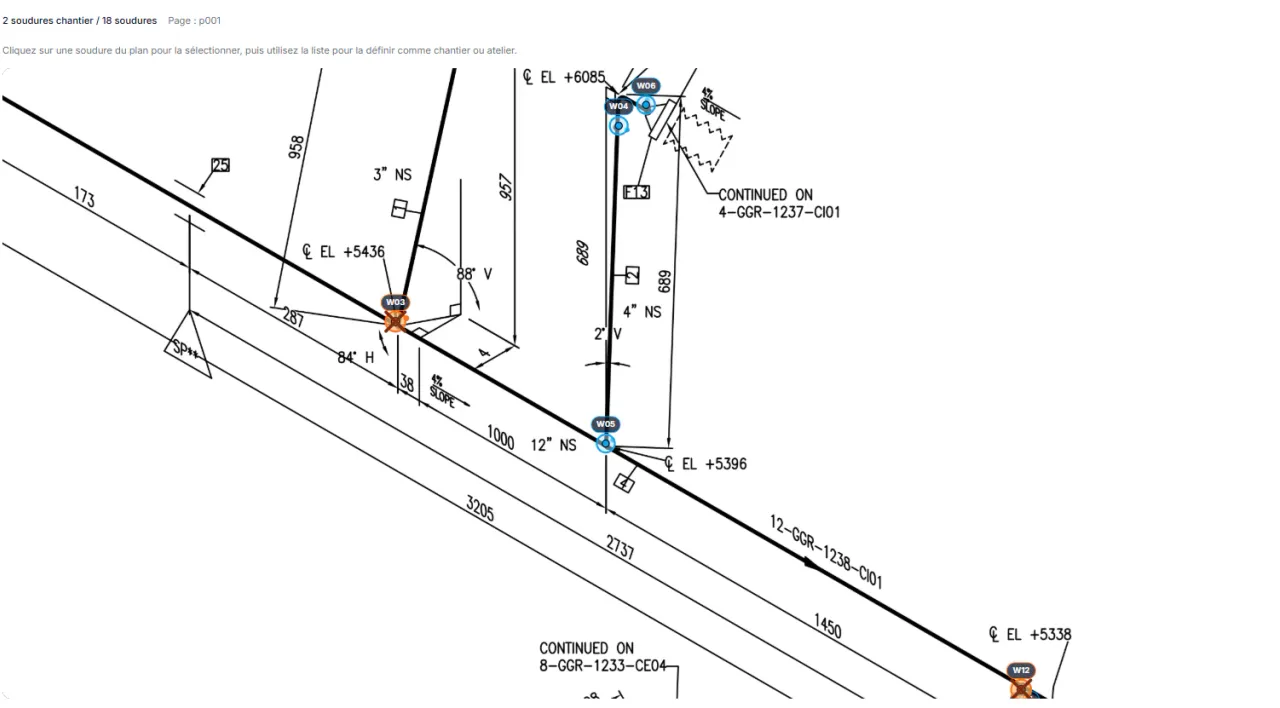
PipeVision automatically generates an initial set of weld callouts that users can edit and reposition. Once the shop / field allocation has been validated, welds and the bill of materials are grouped to prepare fabrication, build the weld book and pass data to other systems.

Grouped PipeVision results with CSV and JSON export actions
Production-ready dataWelds and the bill of materials can be grouped, checked and exported as CSV or JSON.

05 — Inspect

Structure the items that must be monitored over time.

The network is broken down into inspection items, including supports and the technical properties needed to monitor the line. Callouts follow the convention defined with your teams, and the data is made available in an actionable table.

Inspection item callouts with a preview of the extracted data
Prepare inspectionsPipe lengths are split between supports, and the components to be checked receive callouts with their associated data.

PipeVision use cases

From drawings to operational decisions.

Every use case starts from the same data, linked to the drawing and verifiable by your teams.

Estimate without recounting

Count components and welds, consolidate quantities and calculate equivalent inches.

Trace every quantity back to the drawing

Compare reported quantities with those linked to the drawing and trace every discrepancy to its source.

Prepare fabrication deliverables

Validate the allocation of welds between shop and field before preparing fabrication deliverables.

Structure inspection items

Identify the pipe lengths, components and supports to be checked, together with their technical data.

Reuse data in your systems

Group welds and the bill of materials, then export the available data as CSV or JSON.

Today → Tomorrow

The information already exists. Yet it is copied, lost and sometimes measured again.

The same information is still recounted, copied and checked across documents and systems that do not communicate.

Today

The same information, in several isolated copies.

Estimating — quantities recountedFabrication — callouts recreatedWelding — data copied againInspection — information recreated

At every handover, teams copy, check and enter the same information into a new deliverable or tool.

Tomorrow with Valltis

One reference drawing, reused data.

Isometric drawing and structured technical data
Components & BOMNetwork & weldsEstimating & fabricationWeld book & inspection

Components, welds and their properties are extracted, structured and then reused at every stage.

Information extracted and structured once. Reused at every stage.

Our approach

The work comes first. Technology comes second.

Automation, software and artificial intelligence are means to an end. Their value is measured by the time returned to teams and the quality of their decisions.

  1. 01

    Understand the actual work

    Observe the documents, constraints and operational decisions.

  2. 02

    Automate repetitive work

    Remove manual handling without removing control.

  3. 03

    Keep experts in the decision loop

    Present verifiable information, never a black box.

  4. 04

    Choose technology that serves a purpose

    Use AI only when it provides a better answer to the problem.

Controllable results

Every result remains linked to the drawing.

PipeVision makes data controllable and reusable while keeping validation in the hands of operational teams.

  1. 01

    Linked to the drawing

    Every data point remains locatable on the drawing and verifiable in its document context.

  2. 02

    Available exports

    Welds and the bill of materials can be exported as CSV or JSON.

  3. 03

    Editable results

    Suggested data can be corrected and completed in its document context.

  4. 04

    Human validation

    Suggested data remains editable and must be validated by the user.

Let’s look at a real case

Let’s try it with one of your drawings.

A demonstration using your own documents is the best way to assess PipeVision.

Request a demo